
We use essential cookies to make our site work. With your consent, we may also use non-essential cookies to improve user experience, personalize content, and analyze website traffic. For these reasons, we may share your site usage data with our analytics partners. By clicking “Accept,” you agree to our website's cookie use as described in our Cookie Policy. You can change your cookie settings at any time by clicking “Preferences.”
For neighbors and community members

You heard a data center is coming. Here is what that actually means.

The brochures will not tell you how much water it drinks, how loud the generators are at the property line, or whose school is in the zone of impact. We will. With the methodology cited and the same numbers your council will see.

What you just heard about

These campuses are bigger than the press release makes them sound.

Water use
Up to several million
gallons of water / day

A single hyperscale campus drinks as much water as a small city, every day. The source can be potable, recycled, or non-potable — the permit says which.

continuous draw
100 – 1,000 MW

Comparable to a medium-sized city. New transmission, new generation, or both.

diesel generators
Dozens to hundreds

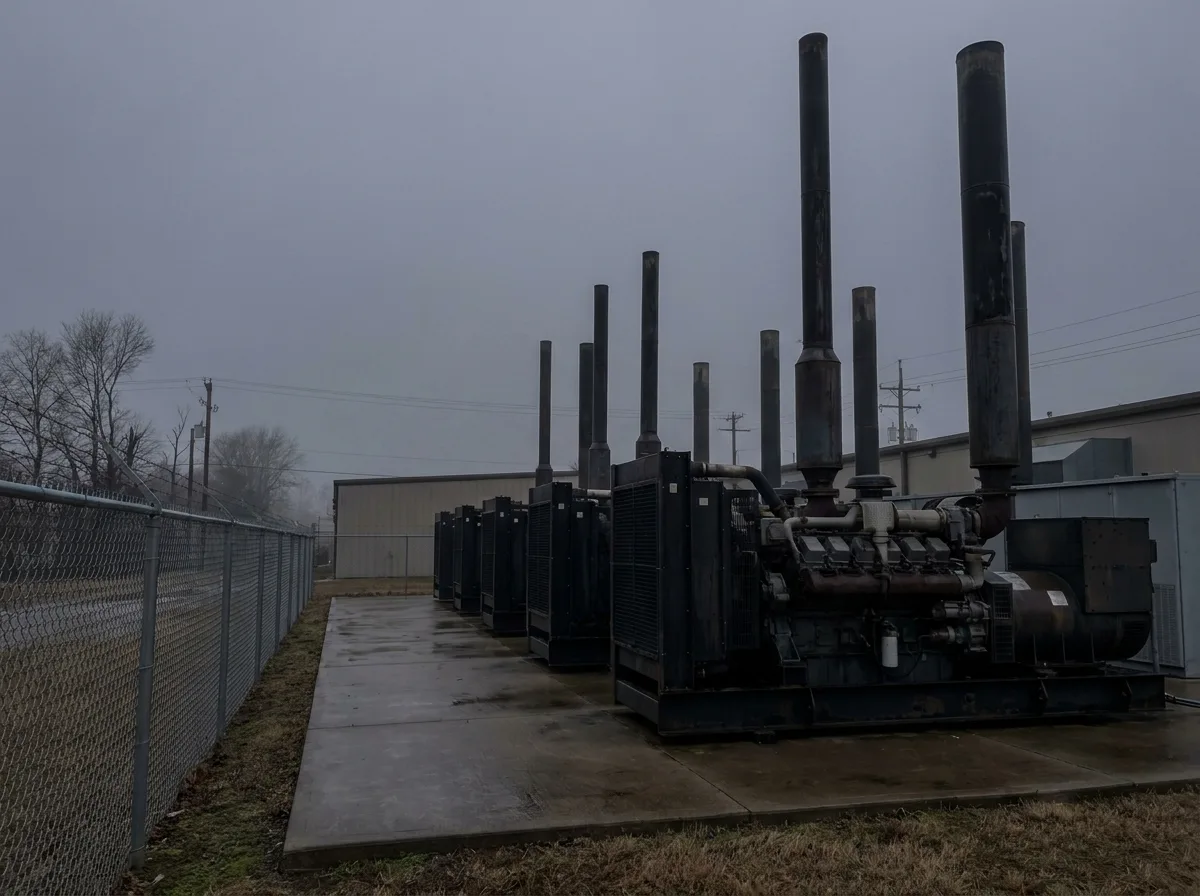
Tier 2 or Tier 4 backup units. Tested every month. Each one is an emission source.

noise reach
Up to ½ mile

80–100 dB at the property line during generator load tests.

What you might be wondering

The real questions, not the FAQ ones.

These are the things you actually say at the kitchen table. Each one has a specific, sourced answer. None of them is a brochure line.

You might be thinking

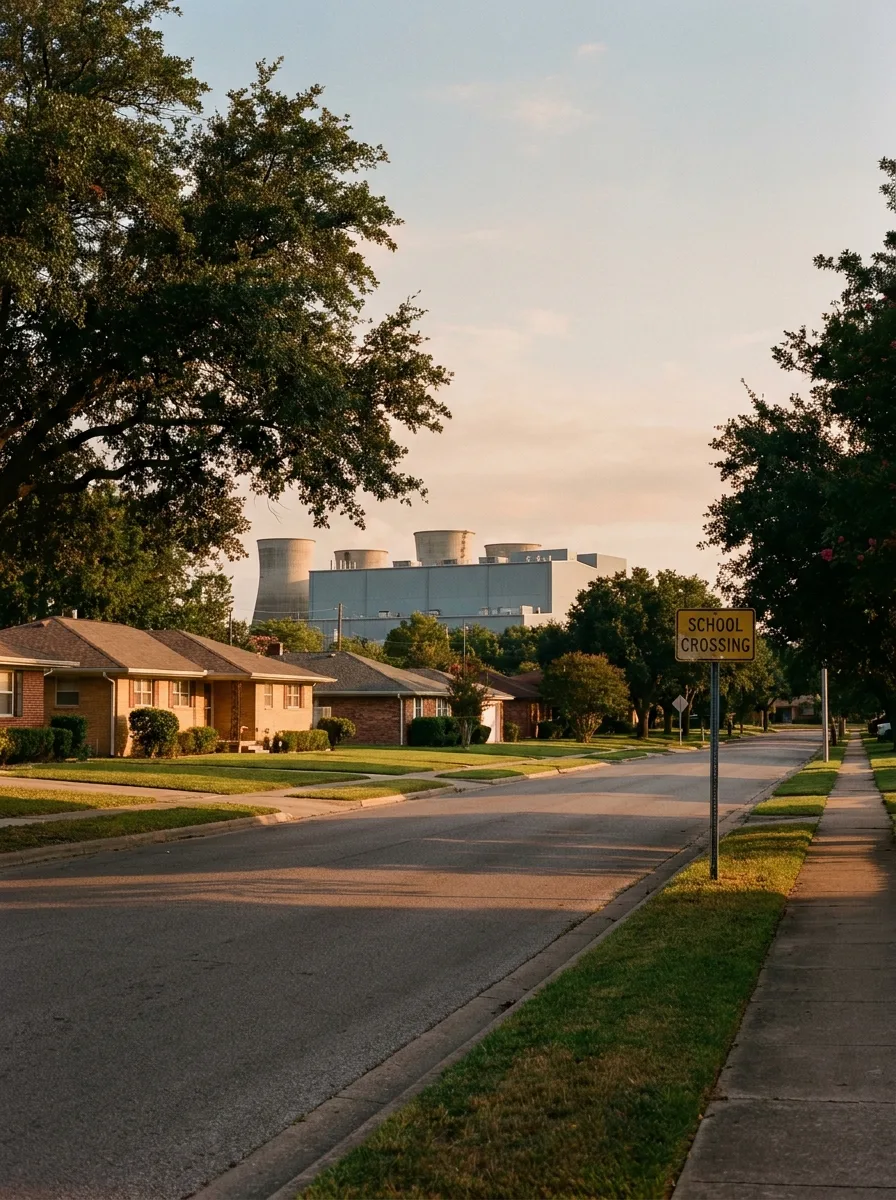
“My kid’s elementary school is right down the road.”

Will the diesel exhaust reach the playground?

What we can show you

Distance, wind, stack height — it depends on the site.

A Zone of Impact map can be modeled for every permit, showing where emissions are predicted to reach and at what concentrations. If a school, hospital, or sensitive receptor falls inside the zone, the report says so — with the methodology cited so the developer cannot quietly rewrite the answer.

EPA AirToxScreen + CA OEHHA methods
You might be thinking

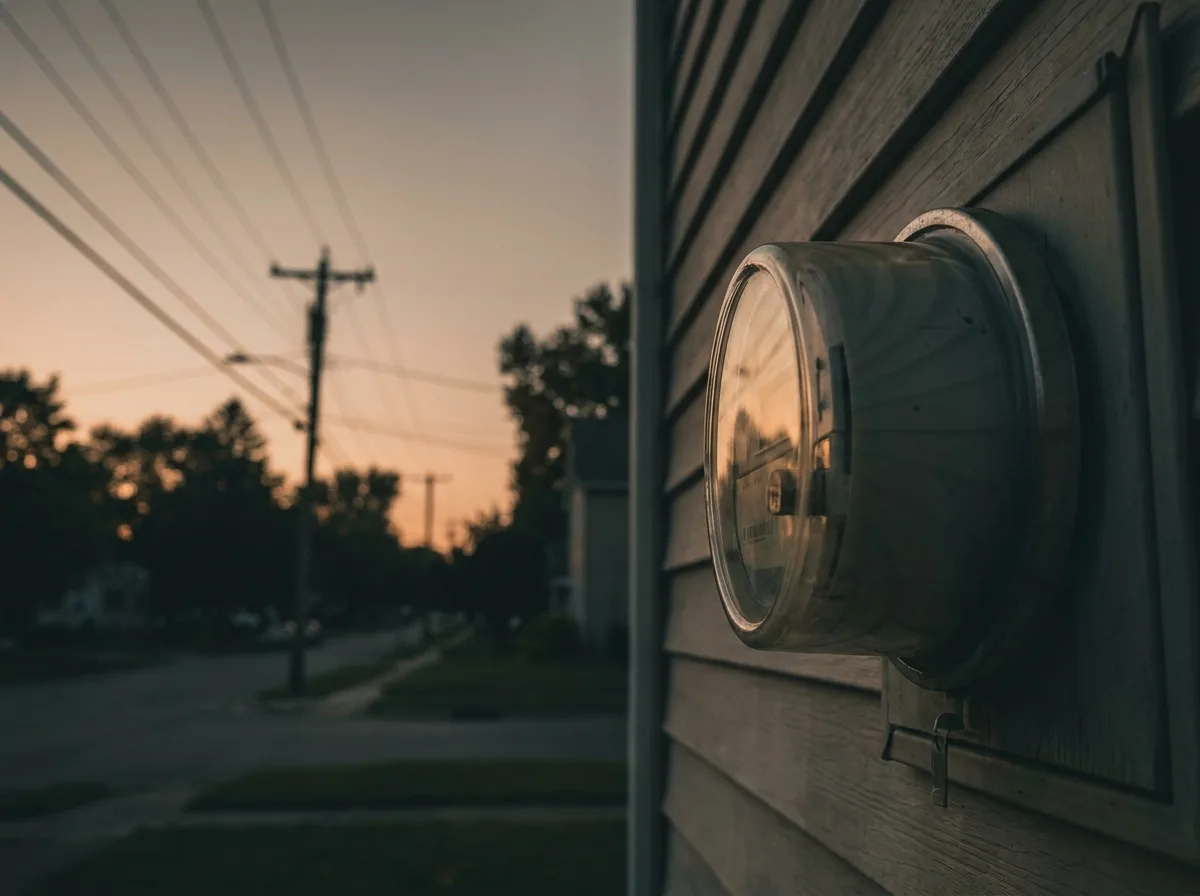
“Are my water and electric bills going to go up?”

Someone has to pay for the new pipes and transmission lines.

What we can show you

Whether bills move depends on the disclosed sourcing and the local rate base.

The disclosed water and energy use per project can be compared to your local utility capacity, so you can ask informed questions at the public hearing instead of guessing. Closed-loop cooling, recycled water, and non-potable sources all change the answer.

Source: permit applications + utility integrated resource plans

You might be thinking

“They keep saying it is safe.”

But the campus has hundreds of diesel generators. What does that actually mean for my air?

What we can show you

Each Tier 2 or Tier 4 generator emits NOx and particulate matter on every test run.

Cumulative emissions and the cancer risk they add for the people living and working nearby can be modeled using EPA AirToxScreen and OEHHA methods. The numbers are sourced and traceable, not a summary written by the developer. Generators are tested monthly and run during real outages.

Modeled per EPA AERMOD + OEHHA cancer slope factors

You might be thinking

“I only just heard about this and the council vote is in two weeks.”

Why am I finding out now?

What we can show you

Most of the technical environmental review happens after the zoning vote, not before it.

The data can land on the table before the vote — if someone independent produces it. A Community Impact Brief shows what is known, what is missing, and what questions still need detail, so your council can ask the right questions and you can hold them to specific commitments.

Same brief reaches you and your council on the same day

Meet LSARS

Someone is already putting these numbers on the table.

LSARS is an independent regulatory analysis platform. Permit applicants pay for the work, but the methods are published by the EPA and the California Office of Environmental Health Hazard Assessment. We cannot edit the numbers. Neither can the developer.

For every project in active permitting, we produce a Community Impact Brief that names the actual impacts on your street, the populations affected, and the questions still missing answers. The same brief reaches you, your council, and the applicant’s team on the same day.

Same data. Three audiences. Same day.

You

Community Impact Brief

A plain-English summary of what this project actually does to your street, your school, and your water source — and the questions still missing answers.

Your council

Public dashboard & Zone of Impact maps

Sourced data your council uses to negotiate specific conditions on the project, not just an up-or-down zoning vote.

Applicant

Sourced regulatory filings

The same calculations they file with the permit. The methods their EPA submission requires. They cannot rewrite our numbers.

What you receive

Here is what your brief looks like.

A Community Impact Brief takes the regulatory filings, the modeled emissions, the disclosed water and energy use, and the post-approval commitments — and puts them on one page in plain English.

What is known. What is missing. What your council can negotiate. Sourced, with the methodology cited, and delivered the same day it goes to your council and to the applicant.

Sample Community Impact Brief — sourced data on workforce, health, traffic, and the questions still missing answers, with status tags on every section.

You are not powerless

Here is what actually changes outcomes.

When the data lands on the table before the vote, the conversation changes from a yes-or-no zoning question into a discussion about conditions, commitments, and accountability. That is what trust looks like in practice.

01
Step 01

Get the question list

A printable list of focused questions tailored to projects in your county. Specific questions change the conversation from a yes-or-no zoning vote into a discussion about conditions and accountability.

02
Step 02

Show up at the council meeting

Communities that arrive with specific, sourced data and specific, named conditions tend to get either a better project or a defensible no. Communities that show up unprepared lose the political fight.

03
Step 03

Ask for the Community Impact Brief

Many projects in active permitting now publish a Community Impact Brief and a public dashboard. We will help you find the one for your project, or ask the applicant’s team to publish it.

04
Step 04

Track the promises after the vote

Jobs, infrastructure, water usage, green space. Most communities never check whether the post-approval commitments were delivered. We do, on a public dashboard, with sourced documents.

Pass it on

Send a pre-written email to your council, the developer, or a neighbor.

The full library

Every question, by topic.

Tap a question to read the answer. Or hit Cmd+F and search for the word that is keeping you up at night.

The Numbers

How big is this thing, really?

Water, electricity, noise. The sourced answers, with the methodology cited.

How much water does a data center use?

A typical hyperscale data center can use anywhere from 100,000 to several million gallons of water per day for cooling, depending on size, climate, and cooling technology. Water-cooled facilities use more than air-cooled. Closed-loop systems recirculate. Direct-to-chip and immersion cooling can lower the total. LSARS surfaces the disclosed water use per project, the source (potable, recycled, non-potable), and the impact on local utility capacity, so the question gets a sourced answer instead of a developer talking point.

How much electricity does a data center use?

A single hyperscale campus typically draws between 100 and 1,000 megawatts continuously, comparable to a medium-sized city. AI training workloads push the upper end. The electricity has to come from somewhere, which means new grid expansion, new transmission lines, or new generation. LSARS tracks disclosed load against local grid capacity and shows the modeled impact on rate base and reliability.

How far does noise from a data center travel?

Cooling fans, transformers, and backup generators are the primary noise sources. Sound can travel 1,500 feet to over half a mile depending on terrain, foliage, building geometry, and wind direction. Backup generators on monthly load tests can produce 80 to 100 decibels at the property line. LSARS includes a noise propagation model in the zone of impact report so you can see whether your home, school, or business falls inside the audible footprint.

Will my water bill or my electric bill go up?

Data centers use significant water for cooling and significant electricity for compute. Whether your bills go up depends on local utility rate structures, the project water sourcing plan (potable, recycled, or non-potable), and whether the local grid needs expansion to serve the load. LSARS tracks the disclosed water and energy use per project and compares it against your local utility capacity, so you can ask informed questions at the public hearing.

Health & Proximity

Is this safe to live near?

Distance, wind, stack height. The answers depend on the site, not on the brochure.

How much air pollution will hundreds of diesel backup generators add?

A typical large data center campus runs dozens to hundreds of Tier 2 or Tier 4 diesel generators for backup power. Each generator emits nitrogen oxides, particulate matter, and other pollutants when it runs for testing or actual outages. LSARS calculates the cumulative emissions and the cancer risk they add for the people living and working nearby, using EPA AirToxScreen and California OEHHA methods. The numbers are sourced and traceable, not summarized by the developer.

Are the generators close enough to affect a school nearby?

Distance matters. Wind direction matters. Stack height matters. LSARS produces a zone of impact map for every permit application, showing where modeled emissions are predicted to reach and at what concentrations. If a school, hospital, or sensitive receptor falls inside the zone of impact, the report says so, with the calculation method cited.

Are data centers safe to live near?

In most cases the routine operations of a data center pose limited direct health risk to nearby residents. The real questions are about cumulative emissions from backup generator testing, water and air quality changes, noise, and traffic during construction. LSARS produces a project-specific risk profile that names the actual exposures, the magnitudes, and the populations affected, instead of generic reassurance.

Process & Action

What can I actually do about it?

How the process works, where the leverage points are, and how to use them.

Why am I finding out about these impacts after the council vote?

Because most of the technical environmental review happens after the zoning vote, not before it. By the time the air permit is contested, the construction crew is already under contract. LSARS exists to put the data on the table before the vote. The Community Impact Brief shows what is known, what is missing, and what questions need more detail, so your council can ask the right questions and you can hold them to specific commitments.

How do I check whether the developer kept the promises they made?

Promises about jobs, infrastructure investment, road improvements, green space, and water usage rarely get tracked publicly after approval. LSARS tracks committed benefits against actual delivery on a public dashboard, so you can see what was promised and what has actually been done, with citations to the original commitment documents.

Is the data coming from the developer or from someone independent?

LSARS is paid for by permit applicants but the analysis follows EPA and California OEHHA published methods. The developer cannot change the numbers. Your council and your community see the same report at the same time. Think of it as an independent audit of the project, not a developer brochure.

How do I stop a data center from being built in my community?

You may not need to stop it. You may need to shape it. Communities that go straight to opposition often lose the political fight; communities that arrive at the public hearing with specific, sourced data and specific, named conditions tend to get either a better project or a defensible no. The questions on this page are designed to give you the data. The next step is the council meeting and the entitlement conditions. If the project genuinely cannot be made safe at this site, the same data is what supports a referendum or legal challenge later.

What can I bring to my next council meeting?

A focused list of questions that name specific impacts: total generator emissions, water sourcing, school proximity, noise propagation, traffic studies, post-approval benefit tracking. We publish a printable list. Bringing specific questions changes the conversation from a yes-or-no zoning vote into a discussion about conditions and accountability.

One thing to do today

Bring sourced questions to your next council meeting.

We will email you the printable question list now. When a Community Impact Brief is published for a project in your county, you get one alert — that is it. No signup wall. No developer brochures.